
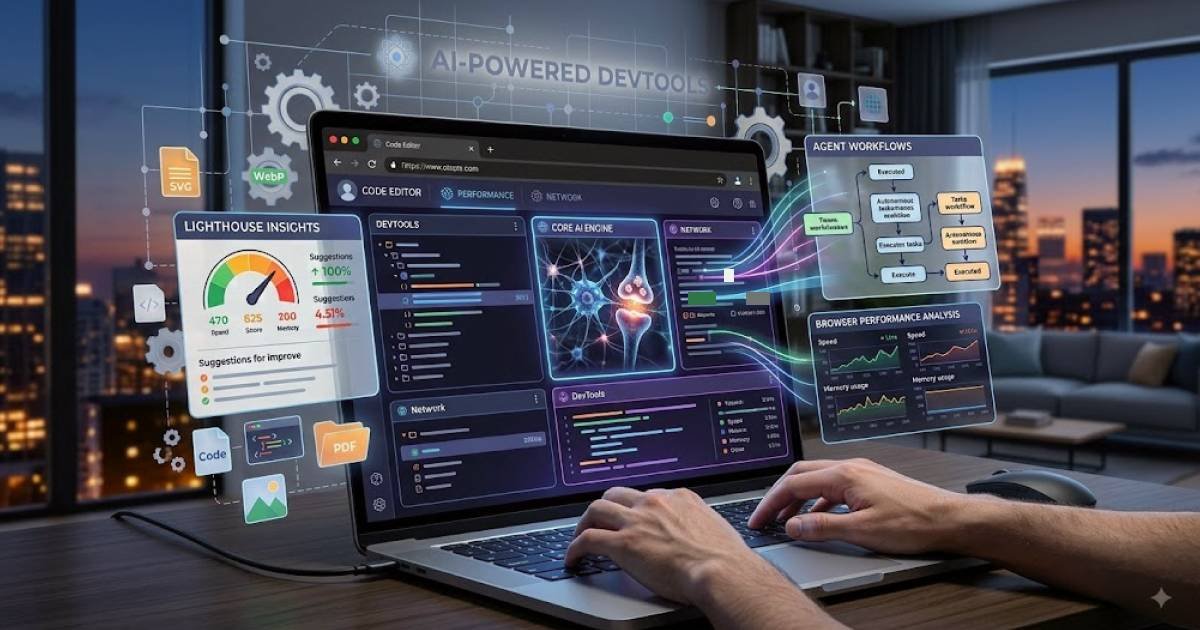
Debugging a website usually means opening DevTools, checking the console, digging through network requests and then trying to figure out which piece of code is actually responsible for the problem.
Chrome is changing that workflow.
Google has been steadily adding AI to Chrome DevTools, and the latest developments are pushing it beyond a simple chatbot that explains error messages. DevTools can now use information from the page, performance traces, network activity and Lighthouse insights to investigate problems with much more context.
That shift is worth watching because it changes what developers may expect from browser debugging tools over the next few years.
What Is Changing in DevTools?
Chrome’s AI assistance is powered by Gemini and is designed specifically around web development.
Instead of copying an error into an external AI tool and explaining what happened, developers can ask questions from inside DevTools. The system can work with information from the page being inspected and help investigate styling, networking, performance and source-code problems.
The newer workflow goes further.
In Chrome 149, Google added Lighthouse and related performance insights to AI assistance. The tool can use that information to provide a broader analysis of a page rather than treating an individual issue in isolation. It can also present information about areas such as Core Web Vitals and LCP directly inside the conversation, which makes it useful when investigating issues such as image optimization for web performance.
That sounds like a small interface improvement.
It is not.
Choosing the correct debugging context is often one of the most time-consuming parts of investigating a complicated website.
DevTools Can Now Look Beyond One Error
Traditional debugging often happens one problem at a time.
A console error leads to a source file. A slow request leads to the Network panel. A performance problem leads to a trace. These pieces can be related, but developers have traditionally had to connect them themselves.
Chrome’s newer AI assistance is starting to connect more of those pieces.
In Chrome 149, Google added Lighthouse and related performance insights to AI assistance. The tool can use that information to provide a broader analysis of a page rather than treating an individual issue in isolation. It can also present information about areas such as Core Web Vitals and LCP directly inside the conversation.
For developers working on performance-heavy websites, that could become particularly useful.
Instead of asking, “Why is this request slow?” the more useful question becomes, “What is making this page slow, and what should I investigate first?”
The Bigger Story Is AI Agents
The most interesting part of Google’s work is arguably not the chat panel.
It is the move toward AI agents that can use DevTools themselves.
Chrome DevTools for agents gives coding agents access to browser capabilities used for testing, debugging and verification. Agents can inspect pages, emulate user experiences, run Lighthouse audits and investigate problems using Chrome’s debugging infrastructure.
That creates a different development workflow.
An AI coding assistant does not have to stop after generating code.
It can potentially open the application, interact with it, inspect what happened, find a problem and use browser-level evidence to help diagnose it.
Google has also made the Chrome DevTools MCP server and CLI stable, expanding the connection between DevTools and external coding agents.
This is where browser tooling starts becoming much more interesting.
WebMCP Adds Another Layer
Chrome is also experimenting with WebMCP, a proposed way for websites to expose structured tools that browser-based AI agents can discover and use.
DevTools can already inspect experimental WebMCP tools and test their execution from the Application panel.
For developers, this means debugging may eventually involve more than checking whether a page looks correct.
Websites will increasingly need to behave correctly when an AI agent interacts with them.
That could become an important part of web development as agent-based browsing becomes more common.
What Developers Should Take From This
There is no reason to throw away normal debugging skills.
AI assistance can make investigation faster, but developers still need to understand what the browser is showing them. An AI-generated explanation can be useful without necessarily being correct.
The safest workflow is still straightforward:
Ask AI → inspect the evidence → verify the change → test again.
That matters even more when an agent can modify code.
A fast automated fix is not necessarily a good fix.
Developers should also become comfortable with the browser’s underlying tools: Network, Performance, Elements, Console, Lighthouse and device emulation. AI becomes much more useful when the developer understands what those tools are actually measuring.
What This Could Mean for the Future
The direction is fairly clear.
DevTools is moving from a collection of panels that developers operate manually toward an environment where humans and AI agents can investigate a website together.
Today, that might mean asking why a page has a performance problem.
Tomorrow, the workflow could look more like this:
Build → run → inspect → diagnose → fix → verify.
The important part is the verification step.
That is where browser-connected AI has an advantage over an AI assistant that can only see the source code. A browser knows what the application actually did.
It can see the rendered page, network requests, runtime behavior and performance measurements.
For web developers, that could make AI-powered debugging far more useful than simply asking a chatbot to guess what went wrong.
Final Thoughts
Chrome’s AI-powered DevTools story is bigger than adding Gemini to a developer panel.
The real change is the connection between AI, the browser and the evidence produced while a website is running.
That is likely to matter long after today’s specific DevTools features change.
Developers who learn how to work with browser-based AI agents, performance diagnostics and automated verification will be better prepared for the next stage of web development.
The browser is no longer just where the website runs.
Increasingly, it is becoming part of the development team.
Frequently Asked Questions
Is AI assistance already available in Chrome DevTools?
Yes. Chrome DevTools includes AI assistance powered by Gemini, with capabilities for areas such as styling, networking, performance and source code. Availability can depend on Chrome version, account, settings and feature rollout.
Can AI fix website problems automatically?
AI assistance can suggest code changes and generate prompts for coding agents. Some older automated styling-fix capabilities are being phased out in favor of workflows where developers can review and send the generated work to a coding agent.
What are Chrome DevTools for agents?
They provide AI coding agents with browser-level capabilities for tasks such as inspecting pages, testing user experiences, running Lighthouse audits and debugging applications.
Will AI replace Chrome DevTools?
Not likely. AI is being added on top of the existing debugging infrastructure rather than replacing the underlying tools. Developers still benefit from understanding the browser’s actual diagnostics and verifying what an AI system suggests.