
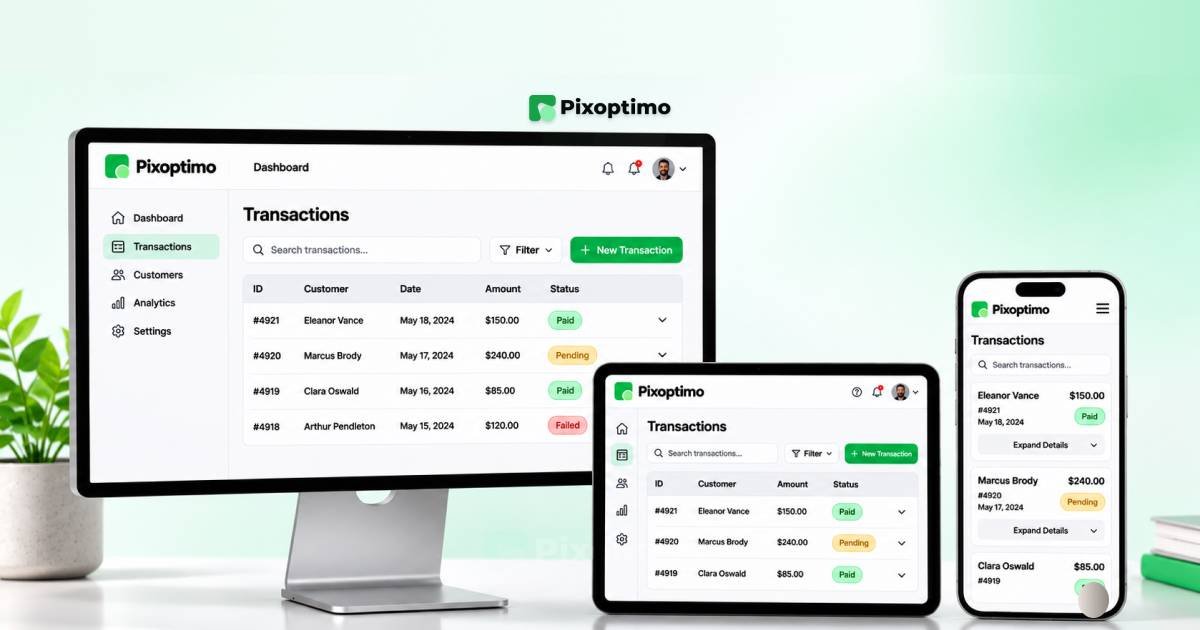
Data tables are among the most difficult interface components to adapt for mobile screens. A desktop dashboard might have enough room for customer names, transaction IDs, dates, statuses, amounts and action buttons. On a phone, those same columns compete for a fraction of the available space.
Shrinking the font, reducing cell padding or forcing every column into a narrow viewport rarely solves the actual problem. It makes the information harder to read without changing how people interact with it.
The better approach is to rethink how the data should be presented.
A responsive data table does not always need to remain a traditional table on every screen. Depending on the information and user task, it can become a horizontally scrollable table, a collection of stacked cards, a compact summary with expandable details or a filter-first mobile interface.
This guide explores seven responsive data table patterns, including practical layout examples, implementation considerations and accessibility requirements. It is intended for SaaS designers, dashboard designers, frontend developers and product teams building data-heavy interfaces.
Quick Summary
- Responsive data tables should adapt to user tasks, not just screen dimensions.
- Horizontal scrolling works well when users need to compare multiple columns.
- Priority columns keep essential information visible while reducing mobile clutter.
- Stacked cards are useful when users inspect records individually.
- Expandable rows and detail drawers reveal additional information without overwhelming the main view.
- Column hiding should be based on information importance, not arbitrary screen width.
- Filter-first views work well when users need to find specific records in large datasets.
- Semantic HTML, readable labels, keyboard access and screen-reader support must remain part of the design.
Why Desktop Data Tables Fail on Mobile
A data table is designed around relationships between rows and columns. Each row represents a record, while each column describes a particular property of that record.
That structure works naturally on wide screens because users can scan across a row and compare values vertically.
Mobile screens introduce a different constraint. Their narrow width makes it difficult to preserve every column without compromising readability.
Consider an orders table in a SaaS dashboard:
| Order | Customer | Date | Status | Amount |
|---|---|---|---|---|
| #1048 | Alex Morgan | Nov 12 | Paid | $240 |
| #1049 | Sarah Lee | Nov 13 | Pending | $180 |
| #1050 | Daniel Kim | Nov 14 | Refunded | $95 |
On desktop, all five columns fit comfortably. On a phone, the same layout may force the customer name, date and amount into narrow spaces. Users may need to scroll sideways without realizing more information exists.
There is no single solution for every dataset. A finance report that requires numerical comparison has different needs from an order list where users mainly want to find a customer’s payment status.
Before choosing a responsive pattern, answer three questions:
- Do users need to compare multiple records at the same time?
- Which information is essential for the most common mobile task?
- Do users need to inspect a record or perform actions without leaving the current view?
The answers help determine which of the following seven patterns is most appropriate.
1. Horizontal Scrolling With Clear Visual Cues
Best for: Financial reports, analytics tables, comparison data and datasets where column relationships must remain intact.
Horizontal scrolling is one of the simplest ways to adapt a wide table to mobile screens.
Instead of compressing the columns, the interface preserves their original structure and allows users to move horizontally to inspect additional information.
MOBILE LAYOUT CONCEPT
┌──────────────────────────────┐
│ Monthly Revenue              │
│                              │
│ Region  Revenue  Growth  ... │
│ North   $24,500  +12%    →   │
│ South   $18,200   +8%    →   │
│ West    $31,400  +16%    →   │
│                              │
│       Swipe to explore →     │
└──────────────────────────────┘
The most important design decision is discoverability. A horizontal scroll bar is not always visible on touch devices, so users need another indication that more columns exist.
Useful visual cues include:
- A subtle gradient at the right edge.
- A partially visible next column.
- A short instruction such as “Scroll horizontally to view more”.
- A visible scroll bar where appropriate.
- A frozen first column when the table is wide enough to justify it.
A practical implementation:
<h2 id="revenue-heading">Monthly revenue</h2>

<div
  class="table-scroll"
  role="region"
  aria-labelledby="revenue-heading"
  tabindex="0"
>
  <table>
    <caption>Monthly revenue by region</caption>

    <thead>
      <tr>
        <th scope="col">Region</th>
        <th scope="col">Revenue</th>
        <th scope="col">Growth</th>
        <th scope="col">Orders</th>
      </tr>
    </thead>

    <tbody>
      <tr>
        <th scope="row">North</th>
        <td>$24,500</td>
        <td>12%</td>
        <td>420</td>
      </tr>
    </tbody>
  </table>
</div>
.table-scroll {
max-width: 100%;
overflow-x: auto;
overscroll-behavior-x: contain;
}
.table-scroll table {
min-width: 36rem;
border-collapse: collapse;
}The wrapper has a descriptive accessible name and is keyboard-focusable, allowing keyboard users to reach and scroll the overflowing content.
Design consideration: Horizontal scrolling is not inherently a bad mobile experience. It becomes frustrating when users cannot tell that more information exists or when important row context disappears during scrolling.
2. Priority-Column Layouts
Best for: Admin dashboards, CRM systems, order management and operational tables with clearly ranked information.
Not every column deserves equal space on a mobile screen.
A priority-column layout identifies the information users need most often and gives it visibility. Less frequently used fields can be accessed through an additional interaction.
For an order management dashboard, the desktop table might include:
- Order ID
- Customer
- Product
- Date
- Payment status
- Total
- Assigned employee
- Actions
On mobile, showing all eight columns creates unnecessary complexity. The primary view could instead display the order, customer, payment status and total.
┌──────────────────────────────┐
│ Orders                       │
│                              │
│ #1048  Alex Morgan           │
│ Paid                  $240   │
│                              │
│ #1049  Sarah Lee             │
│ Pending               $180   │
│                              │
│ #1050  Daniel Kim            │
│ Refunded               $95   │
│                              │
│ [View all columns]           │
└──────────────────────────────┘
The design should reflect actual usage patterns rather than arbitrary assumptions about which columns matter.
For example, a finance administrator may consider the transaction date more important than the customer name. A support team may need the customer and issue status first.
A simple CSS approach can control visibility:
.column-secondary {
  display: table-cell;
}

@media (max-width: 640px) {
  .column-secondary {
    display: none;
  }
}
However, hiding columns should never make essential information inaccessible. Provide a way to inspect omitted fields, such as a details view or column selector.
Design consideration: Priority columns work best when the primary task is clear. If users regularly need to compare the hidden fields, use horizontal scrolling or another pattern instead.
3. Stacked Row Cards
Best for: Customer lists, product records, employee directories, order histories and mobile-first record browsing.
Some tables are less about comparing values across columns and more about finding and inspecting individual records.
In these situations, converting each row into a card can create a more natural mobile experience.
Instead of maintaining a horizontal row, each record becomes a vertical group of labeled information.
MOBILE LAYOUT CONCEPT
┌──────────────────────────────┐
│ Orders                       │
│                              │
│ ┌──────────────────────────┐ │
│ │ #1048          [Paid]    │ │
│ │                          │ │
│ │ Customer                 │ │
│ │ Alex Morgan              │ │
│ │                          │ │
│ │ Date            Amount   │ │
│ │ Nov 12          $240     │ │
│ │                          │ │
│ │ View order →             │ │
│ └──────────────────────────┘ │
│                              │
│ ┌──────────────────────────┐ │
│ │ #1049       [Pending]    │ │
│ │ ...                      │ │
│ └──────────────────────────┘ │
└──────────────────────────────┘
The card format creates more room for labels, status badges and touch-friendly actions.
A simple card structure can use a definition list:
<article class="order-card">
  <header>
    <h3>Order #1048</h3>
    <span>Paid</span>
  </header>

  <dl>
    <div>
      <dt>Customer</dt>
      <dd>Alex Morgan</dd>
    </div>

    <div>
      <dt>Order date</dt>
      <dd>November 12</dd>
    </div>

    <div>
      <dt>Total</dt>
      <dd>$240</dd>
    </div>
  </dl>

  <a href="/orders/1048">View order</a>
</article>
.order-card dl > div {
display: flex;
justify-content: space-between;
gap: 1rem;
padding-block: 0.75rem;
}A key implementation detail: do not simply change every <tr> and <td> into block elements without testing the result. Altering table display behaviour can create accessibility and browser differences. If the mobile interface is a genuinely different card representation, use a deliberate semantic structure and test it with assistive technology.
Design consideration: Cards are excellent for record lookup but can become unnecessarily long when hundreds of records are displayed. Use pagination, virtualization or a different pattern when the dataset is large.
4. Expandable Row Details
Best for: Transaction histories, audit logs, support tickets, project records and datasets with optional secondary information.
Expandable rows preserve a compact table while allowing users to reveal more information when needed.
The default view contains the most important fields. Selecting a row reveals its additional details beneath it.
MOBILE LAYOUT CONCEPT
┌──────────────────────────────┐
│ Transactions                 │
│                              │
│ #1048  Alex Morgan    $240   │
│ Paid                  [−]    │
│ ──────────────────────────── │
│ Payment method: Card         │
│ Transaction ID: TX-1048      │
│ Reference: INV-2048          │
│ Created: Nov 12, 10:30 AM    │
│                              │
│ #1049  Sarah Lee      $180   │
│ Pending               [+]    │
└──────────────────────────────┘
This approach reduces the amount of information competing for attention.
The expanded content can include:
- Additional record properties.
- Secondary identifiers.
- Payment information.
- Status history.
- Contextual actions.
- Related information.
Native HTML disclosure elements provide a straightforward starting point:
<details class="record-details">
  <summary>
    <span>Order #1048</span>
    <span>Alex Morgan</span>
    <strong>$240</strong>
  </summary>

  <dl>
    <div>
      <dt>Payment method</dt>
      <dd>Card</dd>
    </div>

    <div>
      <dt>Transaction ID</dt>
      <dd>TX-1048</dd>
    </div>

    <div>
      <dt>Reference</dt>
      <dd>INV-2048</dd>
    </div>
  </dl>
</details>
Native <details> and <summary> elements provide built-in disclosure interaction. For a fully interactive data table, however, you may need custom behaviour to manage multiple expanded rows, loading states and row-level actions.
Design consideration: Make the expanded state visually distinct and keep the relationship between the record and its details clear. Avoid opening several large detail panels simultaneously if doing so makes the page difficult to navigate.
5. Responsive Column Hiding
Best for: Analytics dashboards, SaaS administration panels, reporting tools and tables with predictable information priorities.
Responsive column hiding is related to priority columns, but its main purpose is to adapt the table progressively as the available width changes.
Rather than switching directly from a full desktop table to a minimal mobile view, the interface can remove less important columns in stages.
For example:
| Viewport | Visible columns |
|---|---|
| Wide desktop | Name, Email, Role, Department, Status, Last active |
| Tablet | Name, Email, Role, Status |
| Mobile | Name, Status |
RESPONSIVE BEHAVIOUR
DESKTOP
Name | Email | Role | Department | Status | Last Active

TABLET
Name | Email | Role | Status

MOBILE
Name | Status
CSS container queries can make this more flexible than viewport-based breakpoints.
.table-container {
  container-type: inline-size;
}

.col-department,
.col-last-active {
  display: table-cell;
}

@container (max-width: 48rem) {
  .col-department,
  .col-last-active {
    display: none;
  }
}

@container (max-width: 30rem) {
  .col-email,
  .col-role {
    display: none;
  }
}
The advantage of container queries is that the table responds to the space available to its own container. This matters when a table appears inside a dashboard sidebar, split layout or narrow widget.
However, a hidden column still contains information users may need. Give users a way to access that data elsewhere, and avoid removing fields that are essential for identifying or interpreting a record.
Design consideration: Use column hiding when the information hierarchy is genuinely clear. Do not hide columns simply because a breakpoint has been reached.
6. Compact Table With a Detail Drawer
Best for: CRM dashboards, finance applications, inventory management, customer administration and interfaces with complex record details.
A detail drawer separates record browsing from record inspection.
The main mobile view contains a compact list or table with a few important fields. When a user selects a record, a drawer opens with the complete information.
MOBILE LAYOUT CONCEPT
┌──────────────────────────────┐
│ Customers                    │
│                              │
│ Alex Morgan           →      │
│ Active                       │
│                              │
│ Sarah Lee             →      │
│ Pending                      │
│                              │
│ Daniel Kim            →      │
│ Active                       │
└──────────────────────────────┘

        SELECT A RECORD

┌──────────────────────────────┐
│ Customer details        [×]  │
│                              │
│ Alex Morgan                  │
│ Active                       │
│                              │
│ Email                        │
│ alex@example.com             │
│                              │
│ Account created              │
│ November 12, 2026            │
│                              │
│ Total orders: 24             │
│                              │
│ [Edit customer]              │
└──────────────────────────────┘
On desktop, the drawer can appear alongside the table without taking over the entire screen. On mobile, it can become a full-screen panel or bottom sheet.
This is particularly useful when a record has many fields, but only a small number are required to scan the list.
For implementation, use a native <dialog> where a modal drawer is appropriate, or a carefully implemented non-modal panel when users need to keep interacting with the underlying content.
A production drawer should consider:
- A clear title identifying the selected record.
- A visible close button.
- Keyboard focus management.
- Escape-key behaviour when appropriate.
- Focus restoration after closing.
- A clear loading and error state.
- Touch-friendly actions.
Design consideration: A detail drawer should not become a second full dashboard. Show the information needed to inspect or act on the selected record, and keep secondary operations organized.
7. Filter-First Mobile Data Views
Best for: Large datasets, analytics dashboards, transaction histories, inventory systems and searchable administration panels.
Sometimes users do not need to see every record at once. They need to find a particular item.
A filter-first layout puts search and filtering controls before the data list. Instead of squeezing dozens of columns onto a phone, it helps users narrow the dataset and inspect the results that matter.
MOBILE LAYOUT CONCEPT
┌──────────────────────────────┐
│ Transactions                 │
│                              │
│ [ Search transactions... ]   │
│                              │
│ [Date] [Status] [Amount]     │
│                              │
│ 24 results          [Filter] │
│                              │
│ #1048                 $240   │
│ Alex Morgan · Paid           │
│                              │
│ #1049                 $180   │
│ Sarah Lee · Pending          │
│                              │
│ [Load more]                  │
└──────────────────────────────┘
Useful controls include:
- Search by name, ID or reference.
- Date-range selection.
- Status filters.
- Category filters.
- Amount ranges.
- Sort options.
- Active-filter indicators.
- A clear-all action.
On mobile, advanced filters can open in a bottom sheet or full-screen panel.
The result list should update predictably, and the interface should communicate how many records match the current filters.
For example:
Showing 24 of 1,240 transactions

Filters:
Status: Paid
Date: Last 30 days

[Clear all]
Avoid applying filters without showing the active selection. Otherwise, users may not understand why records have disappeared.
Design consideration: Filter-first layouts are useful when the dataset is large and search intent is clear. They are less suitable when the primary task involves comparing many records simultaneously.
Comparing the Seven Responsive Data Table Patterns
Choosing the right pattern becomes easier when the primary user task is considered.
| Pattern | Best suited for | Main advantage |
|---|---|---|
| Horizontal scrolling | Financial and comparison tables | Preserves full table structure |
| Priority columns | Operational dashboards | Keeps essential fields visible |
| Stacked row cards | Individual record browsing | Improves mobile readability |
| Expandable rows | Records with secondary details | Reduces initial clutter |
| Responsive column hiding | Space-constrained dashboards | Adapts progressively |
| Detail drawer | Complex record inspection | Separates browsing from details |
| Filter-first view | Large datasets | Helps users find relevant records |
These patterns are not mutually exclusive.
For example, an order management dashboard might use priority columns on tablet, a compact list with a detail drawer on mobile and horizontal scrolling for its financial report.
The best design is often a combination selected around the task rather than a single responsive technique applied everywhere.
Accessibility Considerations for Responsive Data Tables
A responsive table can look excellent and still create serious usability problems for people who rely on keyboards, screen readers or browser zoom.
Accessibility should be part of the table’s structure from the beginning, not an additional styling task.
Use Semantic Table Markup
For genuine tabular data, start with native HTML table elements.
Use:
<table>for the data structure.<caption>to describe the table.<thead>and<tbody>to organize sections.<th>for header cells.<td>for data cells.scope="col"for column headers.scope="row"for row headers.
Example:
<table>
  <caption>Customer account overview</caption>

  <thead>
    <tr>
      <th scope="col">Customer</th>
      <th scope="col">Status</th>
      <th scope="col">Orders</th>
    </tr>
  </thead>

  <tbody>
    <tr>
      <th scope="row">Alex Morgan</th>
      <td>Active</td>
      <td>24</td>
    </tr>
  </tbody>
</table>
This provides programmatic relationships between headers and their associated values.
Make Horizontal Scrolling Keyboard Accessible
If a table overflows horizontally, users must be able to reach and operate its scroll region using a keyboard.
A labeled wrapper with tabindex="0" is a useful starting point.
Do not depend exclusively on touch gestures or hover effects to reveal additional content.
Preserve Labels in Card Layouts
When transforming records into cards, make every value understandable without relying on its original desktop column heading.
For example:
Customer: Alex Morgan
Status: Active
Orders: 24
This is clearer than displaying three unlabeled values.
Make Interactive Controls Easy to Operate
Sorting buttons, filters, expandable rows and action menus should have clear accessible names and visible focus indicators.
Use actual buttons for actions rather than clickable <div> elements. Ensure that touch targets are comfortably sized and spaced.
Support Browser Zoom and Text Resizing
Do not solve mobile overflow by clipping important content.
Users may enlarge text or zoom the browser to inspect information. Data tables are recognized as an exception to WCAG’s re flow requirement in certain circumstances, so horizontal scrolling can be appropriate when preserving the relationship between values is necessary.
That does not justify making every part of the page horizontally scrollable. Keep the scrolling area limited to the table where possible.
Communicate Sorting and Filtering State
If a user sorts a table, make the active column and sort direction clear.
For accessible sortable tables, the relevant header can expose its state through aria-sort. Filter controls should also communicate their selected values and provide a clear way to remove them.
Test With Assistive Technology
Automated accessibility tools are useful, but they cannot replace testing with actual keyboard interaction and screen readers.
Check that users can identify the table, understand its headers, reach every interactive control and inspect the same information available to sighted users.
A Practical Workflow for Designing Responsive Data Tables
Before implementing a responsive table, use a simple design process.
Step 1: Identify the primary task.
Determine whether users are comparing records, searching for one item, monitoring statuses or managing individual entries.
Step 2: Rank the columns.
Separate essential information from secondary details. Use actual user needs rather than assuming every desktop column must remain visible.
Step 3: Choose the mobile pattern.
Select horizontal scrolling, priority columns, stacked cards, expandable rows, a detail drawer or a filter-first view.
Step 4: Design the interaction states.
Account for loading, empty results, errors, active filters, expanded rows, sorting and pagination.
Step 5: Check accessibility.
Review semantic structure, labels, focus behaviour, keyboard access, contrast and screen-reader announcements.
Step 6: Test realistic content.
Test long customer names, large currency values, missing data, multiple status labels and unusually long identifiers. A design that works with short sample values may fail with real records.
Step 7: Test at different widths and zoom levels.
Do not validate only at one popular mobile breakpoint. Test narrow phones, larger phones, tablets, desktop layouts and browser zoom.
Final Thoughts
Responsive data tables are not just a CSS problem. They are an information-design problem.
A desktop table gives users a broad view of many records. A mobile interface needs to decide which relationships and actions deserve attention first.
Horizontal scrolling preserves comparisons. Stacked cards make individual records easier to read. Expandable rows and detail drawers reveal secondary information. Priority columns and responsive hiding reduce clutter, while filter-first layouts help users navigate large datasets.
There is no universal mobile table component that works for every SaaS dashboard, financial product or administration interface.
The most effective approach starts with the user’s task, preserves the meaning of the data and chooses a layout that works within the available space.
When designing the next responsive dashboard, ask a more useful question than “How do we fit this table on mobile?”
Ask: What does the user actually need to see and do on this screen?
That question leads to better responsive interfaces.